fg_scatplot: Easy scatterplot generator, with time specific enhancements
Source:R/scat_ggplot.R
fg_scatplot.RdPlots bivariate plots with some time-series specific enhancements. Rather than programmatically describing graph aesthetics, a simple formula-based approach is used. This approach allows quick specification of many customizaton options.
Usage
fg_scatplot(indata,plotform,type="scatter",datecuts=c(7,66),
               noscales="",xdecoration="",ydecoration="",annotatecorners="",
               tsize=3,psize=1,n_color_switch=7,n_hex_switch=400,repel=TRUE,jitter=c(0,0),
               title="",subtitle="",caption="",axislabels="",
               boundbox=c(),boundboxtype="",gridstyle=NA_character_,legendinside=FALSE,
               tformula=formula("y~x"),returnregresults=FALSE,
               keepcols="", meltvar="variable",melted=NULL)
Arguments
- indata
data.framewith columns for (x,y) coordinates and possibly other categorical data or a date column. Alternatively,indatacan be in long format withmeltvarpresent. Note that aesthetic characteristics (if used) must be present for both long and wide input formats.- plotform
A text formula describing how to set up the graph. The formula is of the general form
y ~ x + option:<column_name>,<aesthetic category> + ...where
yis plotted againstxand aesthetics for each point are controlled by one or moreoptionclauses each followed by zero or more optional parameters. If the option applies to all points then the first parametercolumn_namemust be inindata. By default, points or symbols are plotted. By general category, the options areAesthetic options:
color:column<,aes_set>sets the color of each point or label by data incolumnsymbol:column<,aes_set>sets the symbol or shape cof each point or label by data incolumnsize:column<,aes_set>sets the size of each point by the data incolumn
Date specific options:
doi:recentpartitions data by number of days indatecutsprior to the last day inindatadoi:<doiset>partitions data by date ranges obtained from dates of interest set<doiset>. Seefg_get_dates_of_interest()point:<value|label|anno><all>adds highlights for either the last date inindataor the last date for each group (ifall).valuegives coordinates,labelthe label in thecolorcolumn, whileannoadds lines to each axis.
Text options:
[text|label|labelhilight|tooltips]:column<,aes_set>: Plots the text in charactercolumnas text (without border), label (with border), filled in label, or mouse-over tooltip. (See details)
Other annotations:
ellipseadds an ellipse around the points usingggplot2::stat_ellipse()hull<:quantile>draws a convext hull around points with<quantile>(default 0) points removed. (See details)xline<:level=0>draws a vertical line atlevelyline<:level=0>draws a horizontal line atlevelgrid:<dotted|dotted_x|dotted_y|none>formats background grids
- type
character string for the type of graph to plot:
scatplots points, text or labelslm<one><noeqn><nofill>adds linear regression lines percolorcategory or across all points (lmone).loess<one><noeqn>adds loess line per percolorcategory or across all points (loessone)densityCreates a density plot
if
noeqnis part of the string, equations are suppressed. Ifoneis part of the string, no subcategories are used. `nofill“ removes confidence bands.- datecuts
list of integers (Default
c(7,66)for days prior to last date to make date classes. (See examples anddoi:recentas above.)- noscales
String to suppress guides with any of
<color|size|symbol>- xdecoration, ydecoration
2 element string list to add to either side of an axis label.
- annotatecorners
4 element string list to add notes to each of 4 quadrants of the graph. See examples.
- tsize
default text size (with some scaled variations for graph parts such as titles)
- psize
default point size.
- n_color_switch
(Default 7): Number of distint color categories beyond which colors are taken from gradient scales, unless a color set is specified in a
colorpart ofplotform- n_hex_switch
(Default 400): Number of data points beyond which points are replaced with binned hexagons (see
geom_hex())- repel
(Default TRUE) Text and labels are plotted using
ggrepel()- jitter
Jitter parameters used by
geom_text()orgeom_label()ifrepel=FALSE. Default is no jitter.- title
Title to add to graph
- subtitle
Subtitle to add to graph
- caption
Caption to add to graph
- axislabels
Semicolon separated string with x and y labels, e.g
date;OAS- boundboxtype, boundbox
string describing how to use bounding boxes. If
"identify"is part of the string, then data is truncated to the calculated bounding box and notations to that effect are added to the graph. If not, then points outside the box are dropped.prob|probidentifycalculates bounding boxes from quantilies ofxandydata. See vignette for details.value|valueidentifyare minimum and maximum values ofxandyaxes to show. Ifboundboxis a list of two numbers, the y axis is truncated to those values, Ifboundboxis a list of 4 numbersc(xmin,xmax,ymin,ymax)data is truncated to that box.
- gridstyle
String in
<dotted|dotted_x|dotted_y|none>to contol grids as ingridoption above.- legendinside
(Default: TRUE) Put all guides inside the graph.
- tformula
(Default
y~x) Formula used withinlmorloessstats .- returnregresults
Return a two element list c(plot,regression
data.frame). Only available for linear models, and uses the first amoung optionsc("color","symbol","size","alpha")as grouping variables- keepcols
list of
indatacolumns to be kept with the graph data, useful for further faceting usingggplot2::facet_wrap()- meltvar
(Default
"variable") Ifindatais melted, then this is used to createxandycategories.- melted
(Default:NULL) If
FALSEforces data not to be melted ifmeltvarinindata
Value
A ggplot2::ggplot() object with desired graph, or a ggiraph::girafe() object if tooltips is in the plotform string.
Details
indata can either be in wide ('date' ,'series1',...) format or normalized (long) format
('date','variable','value',...) format. This package infers date columns names from column types and casts or
pivot_wider to get x and y columns. Note that aesthetic characteristics (if used) must be present for both
long and wide input formats.
Default aesehetic sets used for portions of the graph each have their own names, which can be seeing by running
fg_print_aes_list() and modified or added to using fg_update_aes(). The default theme can be modified using
fg_replace_theme(). Both aesthetic changes and theme changes are persistent across R sessions.
Use of doi: in plotform string supercedes color aesthetics otherwise specified. (Is this true?)
If tooltips are used, the result of fg_scatplot must be viewed using print(girafe(ggobj=fg_scatplot(...)))
See ggiraph::geom_point_interactive()
Winsorized hulls with quantile cutoff q are formed using the closest (by euclidean distance) 1-q points to the
geograpic center of the entire set.
Captions are added if data is truncated or omitted by the bounding box procedure.
Examples
# Simple text examples
require(data.table)
dt_mtcars=data.table(datasets::mtcars)
dt_mtcars$id=lapply(rownames(datasets::mtcars),\(x) last(strsplit(x," ")[[1]]))
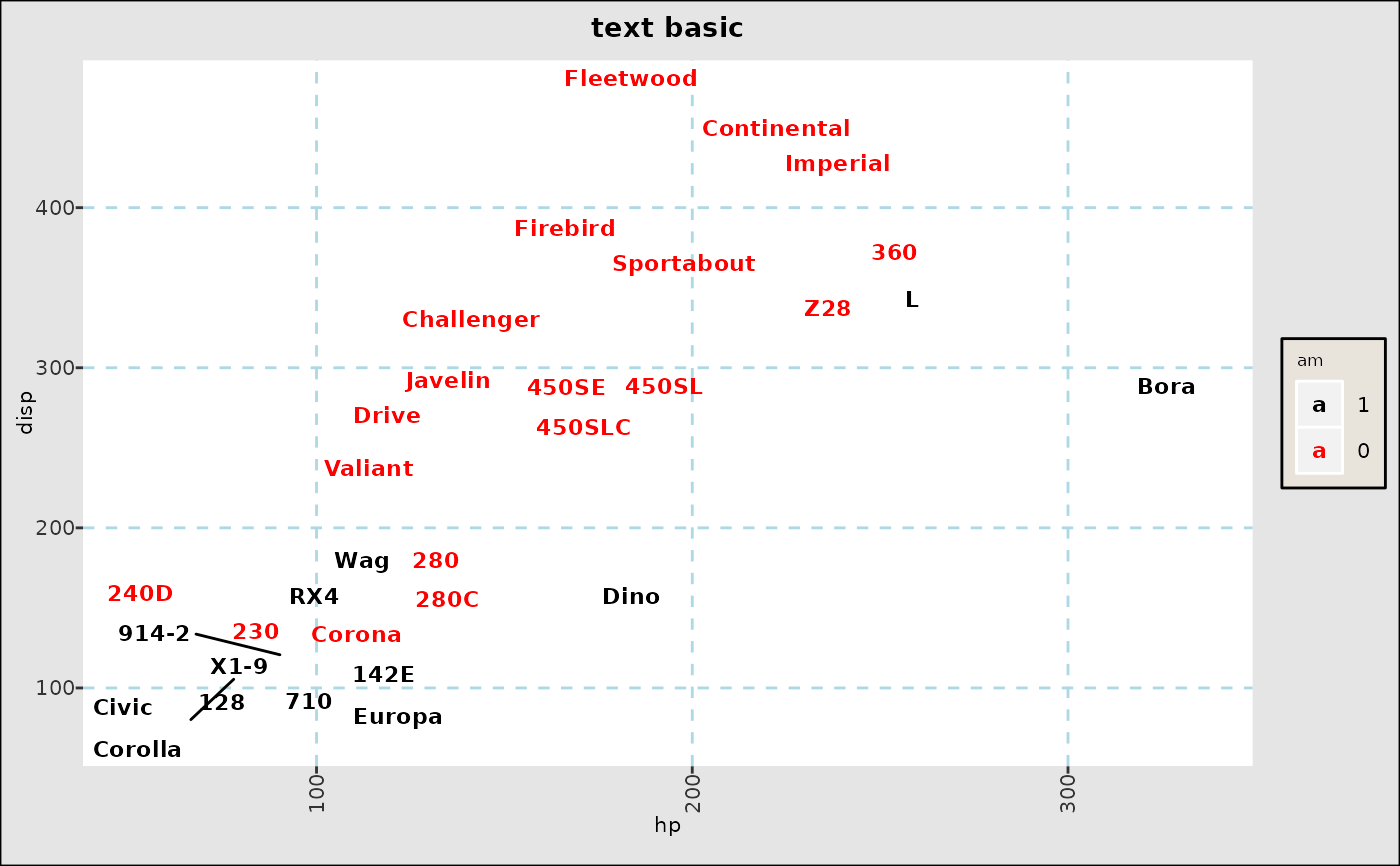
fg_scatplot(dt_mtcars,"disp ~ hp + color:am + text:id","scatter",title="text basic")
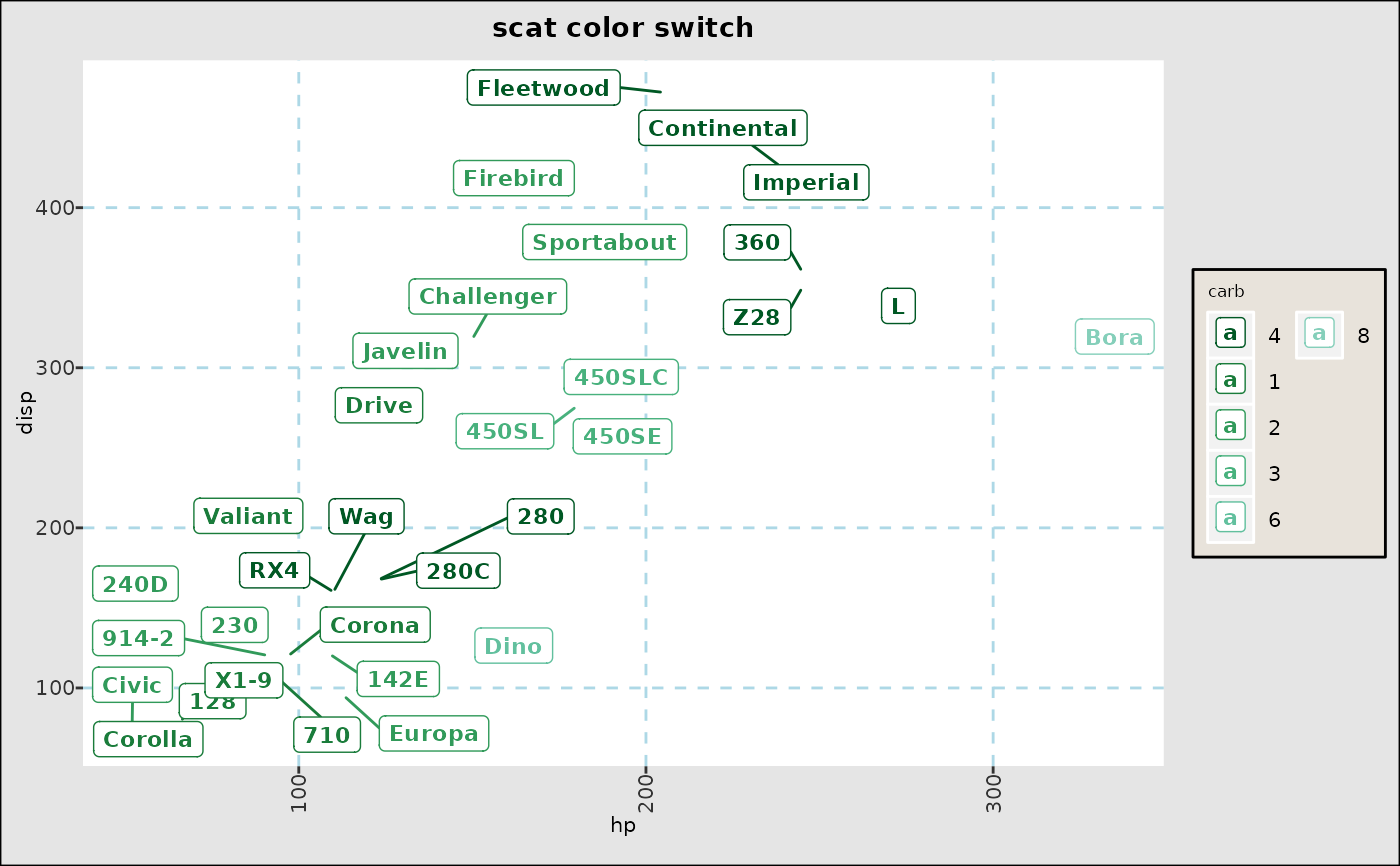
 fg_scatplot(dt_mtcars,"disp ~ hp + color:carb + label:id","scatter",
n_color_switch=0,title="scat color switch")
fg_scatplot(dt_mtcars,"disp ~ hp + color:carb + label:id","scatter",
n_color_switch=0,title="scat color switch")
 # Plotting data with dates:
set.seed(1); ndates <- 400; dlyvol <- 0.2/sqrt(260)
rtns <- cbind(cumsum(rnorm(ndates,sd=dlyvol)),cumsum(rnorm(ndates,sd=dlyvol)))
dttest <- data.table(date=seq(as.Date("2021-01-01"),as.Date("2021-01-01")+ndates-1),
xtest=100*(1+rtns[,1]),ytest=100*(1+rtns[,2]),
ccat=fifelse(runif(ndates)<=0.2,"Rare","mkt"))
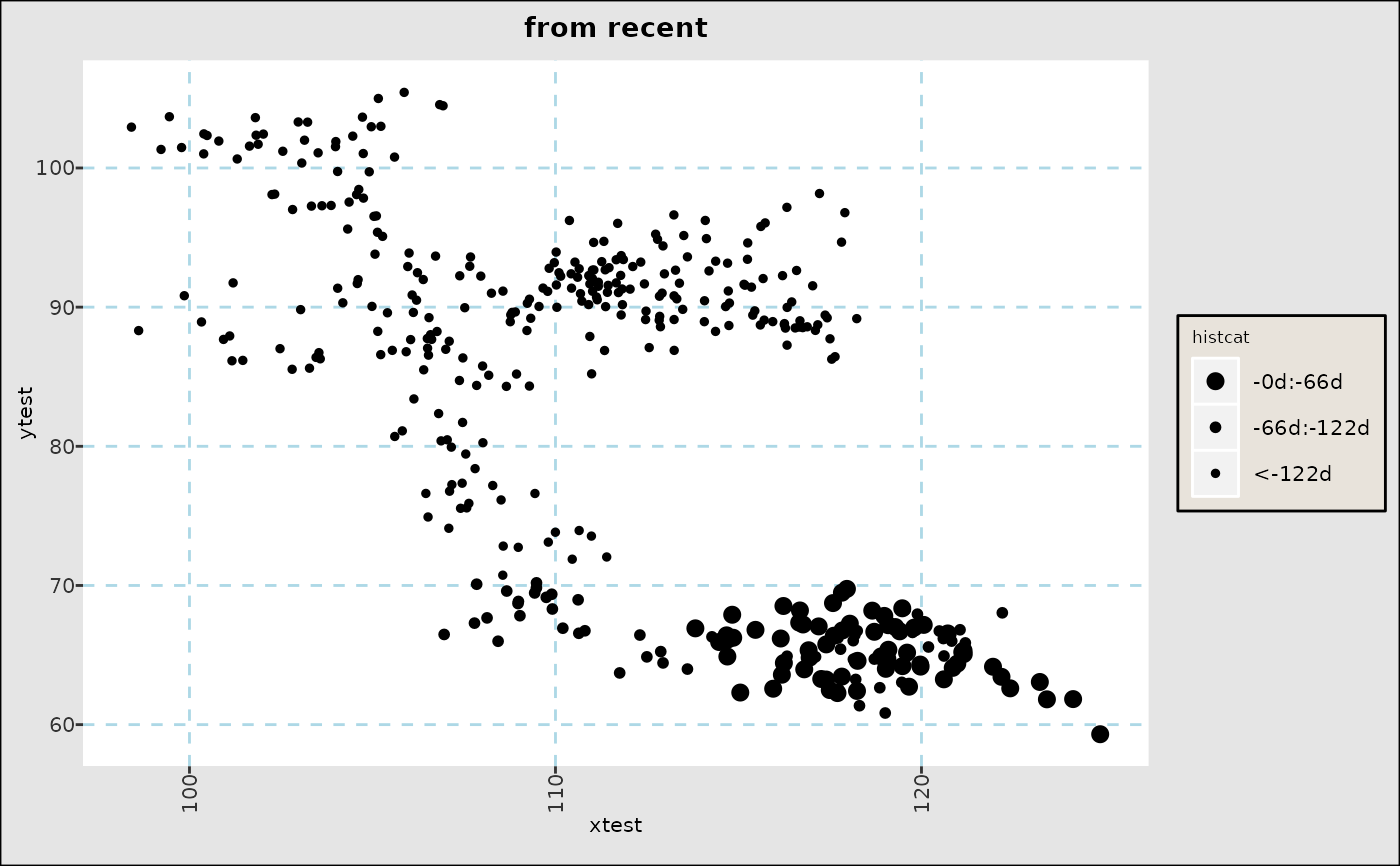
# Making categories out of recent data
fg_scatplot(dttest,"ytest ~ xtest + doi:recent","scatter",datecuts=c(66,122),title="from recent")
# Plotting data with dates:
set.seed(1); ndates <- 400; dlyvol <- 0.2/sqrt(260)
rtns <- cbind(cumsum(rnorm(ndates,sd=dlyvol)),cumsum(rnorm(ndates,sd=dlyvol)))
dttest <- data.table(date=seq(as.Date("2021-01-01"),as.Date("2021-01-01")+ndates-1),
xtest=100*(1+rtns[,1]),ytest=100*(1+rtns[,2]),
ccat=fifelse(runif(ndates)<=0.2,"Rare","mkt"))
# Making categories out of recent data
fg_scatplot(dttest,"ytest ~ xtest + doi:recent","scatter",datecuts=c(66,122),title="from recent")
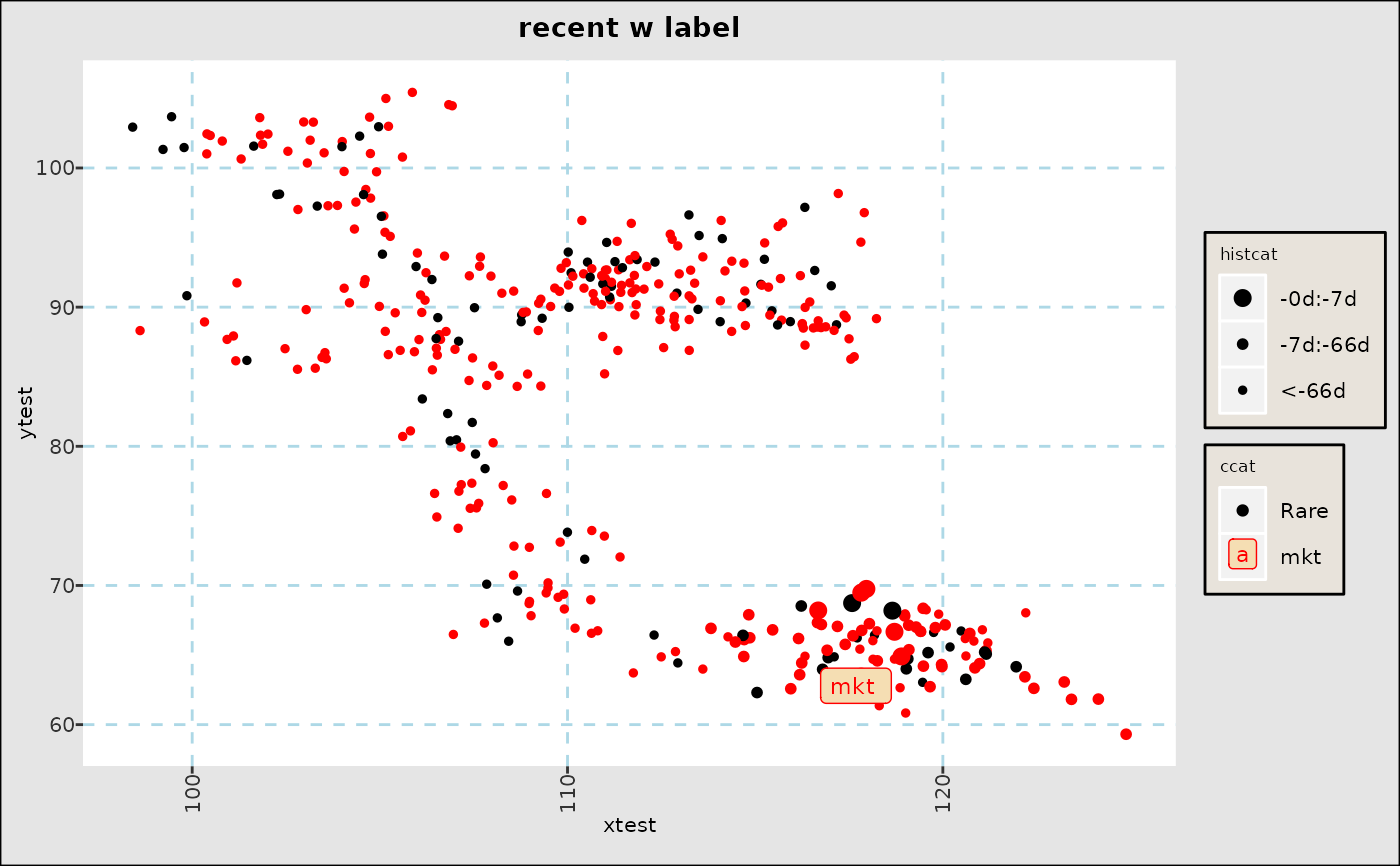
 fg_scatplot(dttest ,"ytest ~ xtest + color:ccat + doi:recent + point:label","scat",
datecuts=c(7,66),title="recent w label")
fg_scatplot(dttest ,"ytest ~ xtest + color:ccat + doi:recent + point:label","scat",
datecuts=c(7,66),title="recent w label")
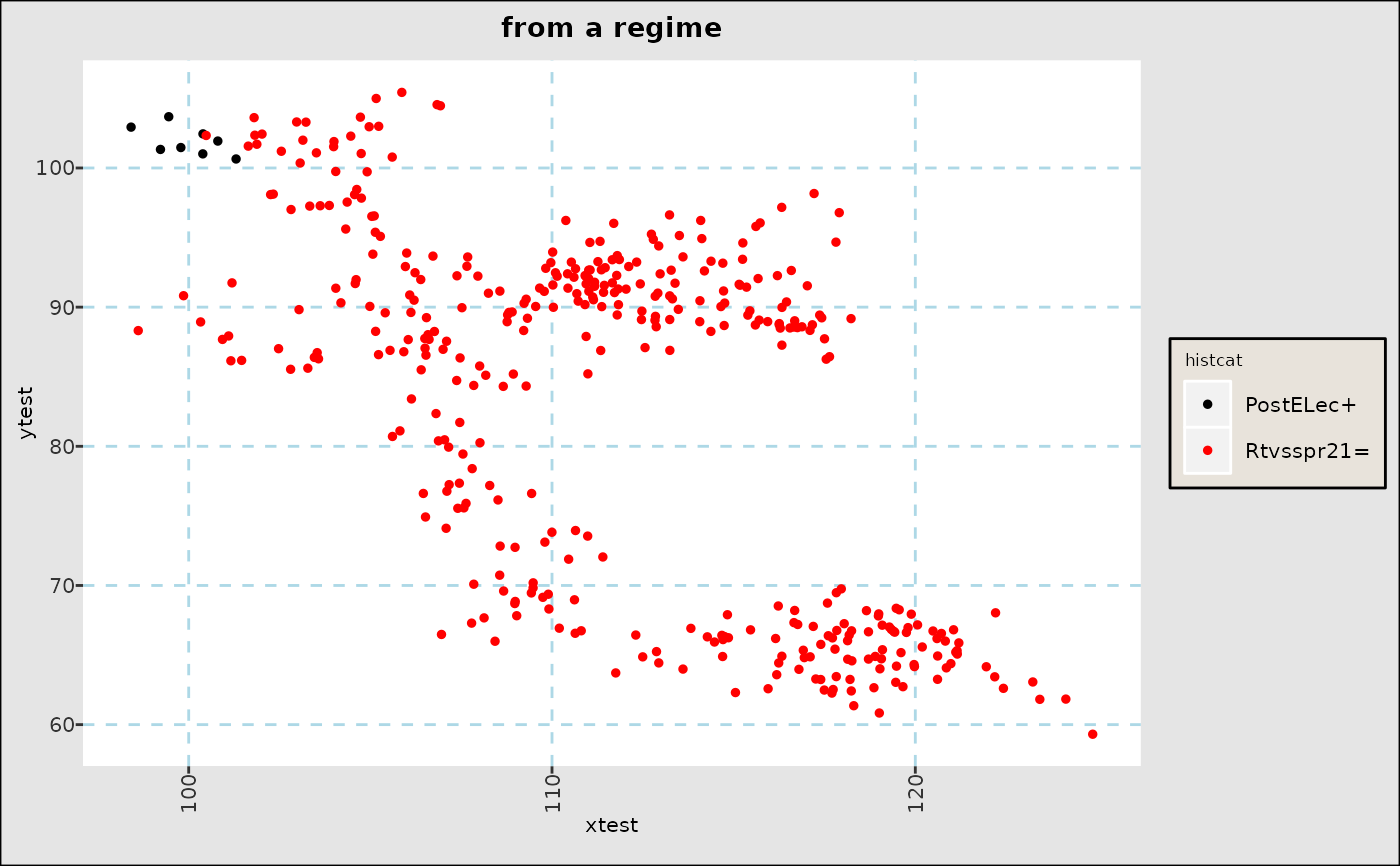
 # Makes categories out of event sets from [fg_get_dates_of_interest()]
fg_scatplot(dttest,"ytest ~ xtest + doi:regm","scatter",title="from a regime")
# Makes categories out of event sets from [fg_get_dates_of_interest()]
fg_scatplot(dttest,"ytest ~ xtest + doi:regm","scatter",title="from a regime")
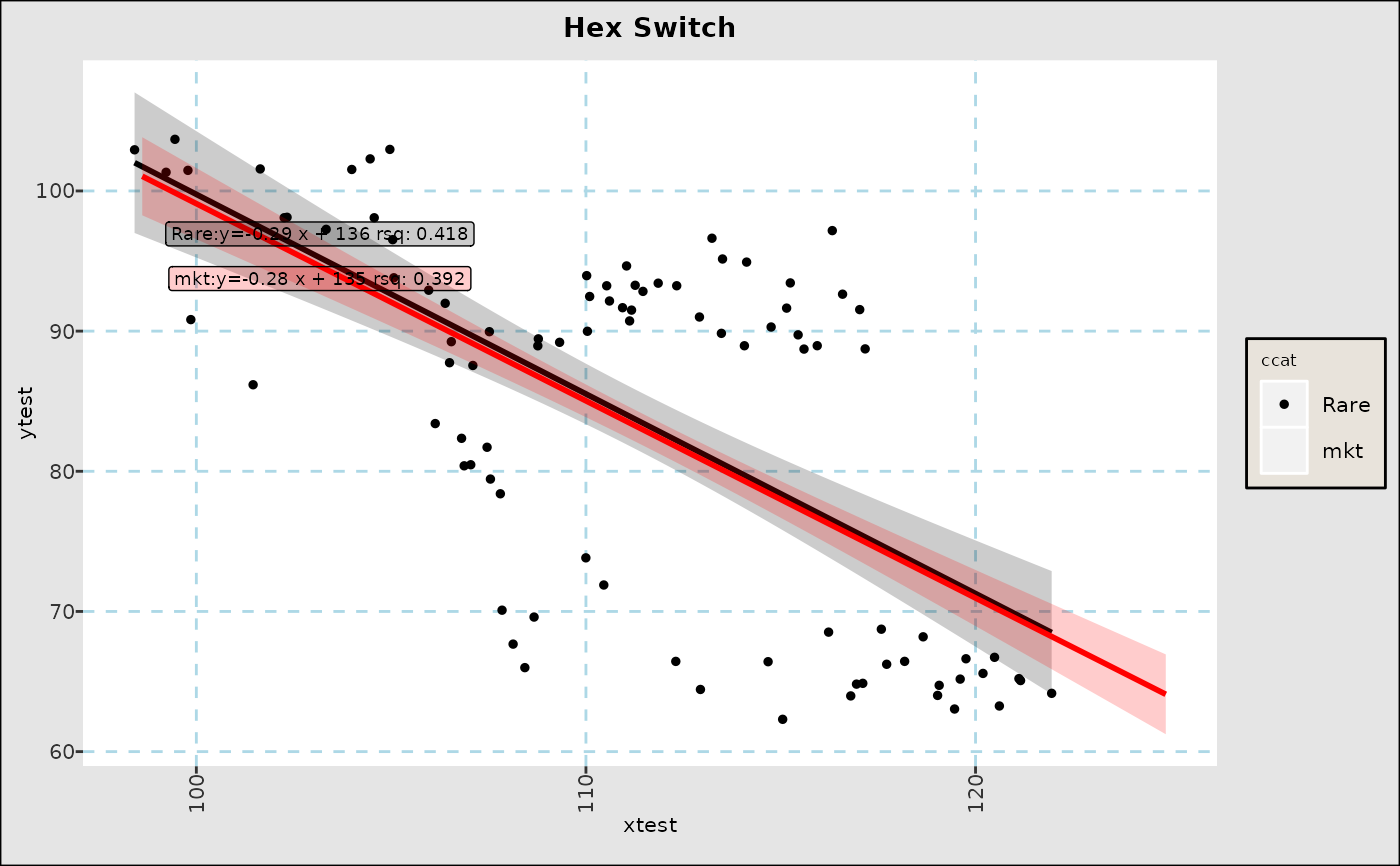
 # Point graphing switches.
fg_scatplot(dttest,"ytest ~ xtest + color:ccat","lm",n_hex_switch=100,title="Hex Switch")
#> Warning: Computation failed in `stat_binhex()`.
#> Caused by error in `compute_group()`:
#> ! The package "hexbin" is required for `stat_bin_hex()`.
# Point graphing switches.
fg_scatplot(dttest,"ytest ~ xtest + color:ccat","lm",n_hex_switch=100,title="Hex Switch")
#> Warning: Computation failed in `stat_binhex()`.
#> Caused by error in `compute_group()`:
#> ! The package "hexbin" is required for `stat_bin_hex()`.
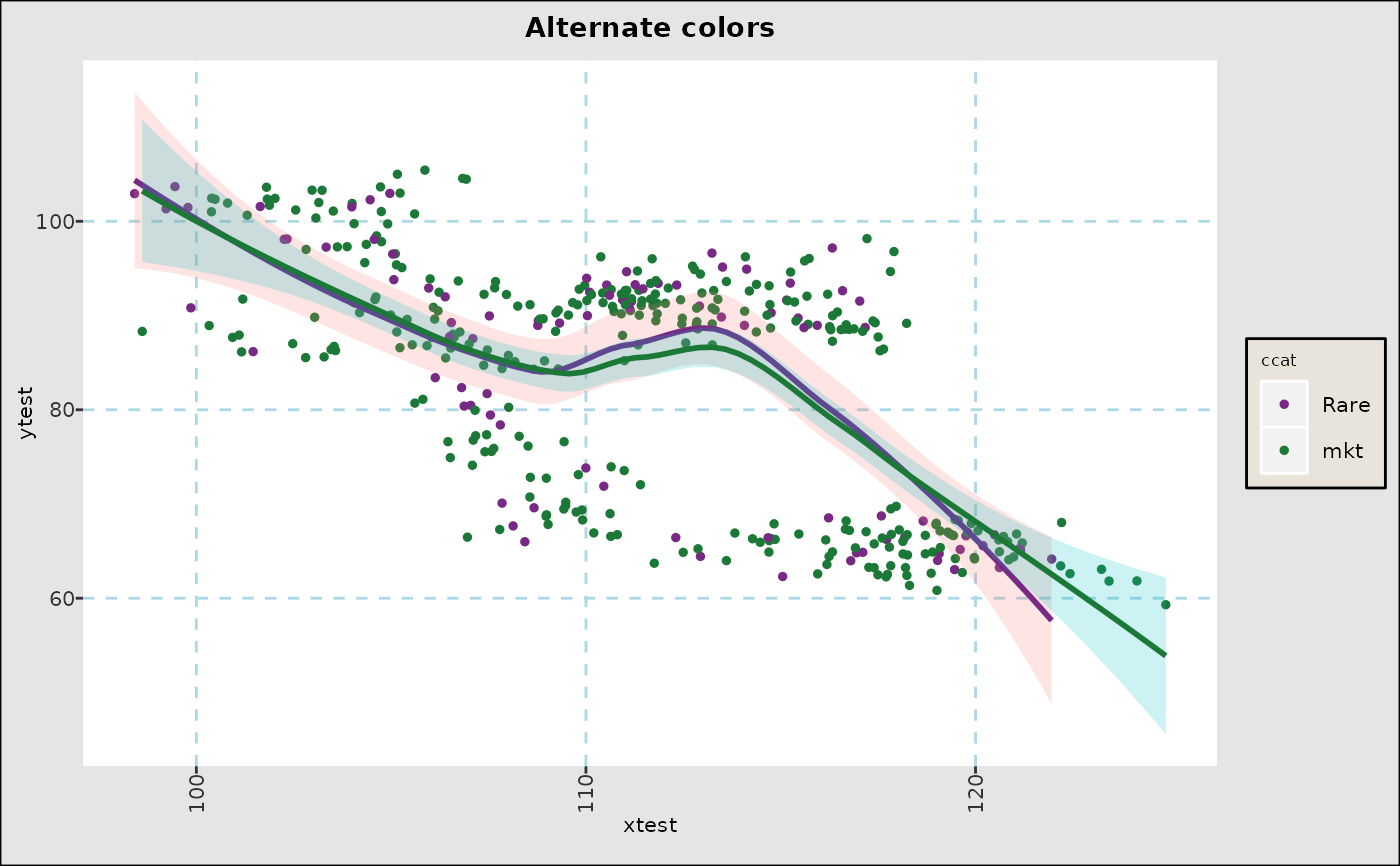
 # Quick changes to aesthetic sets
fg_scatplot(dttest,"ytest ~ xtest + color:ccat,altlines_6","loess",title="Alternate colors")
# Quick changes to aesthetic sets
fg_scatplot(dttest,"ytest ~ xtest + color:ccat,altlines_6","loess",title="Alternate colors")
 # Extra summarizatons
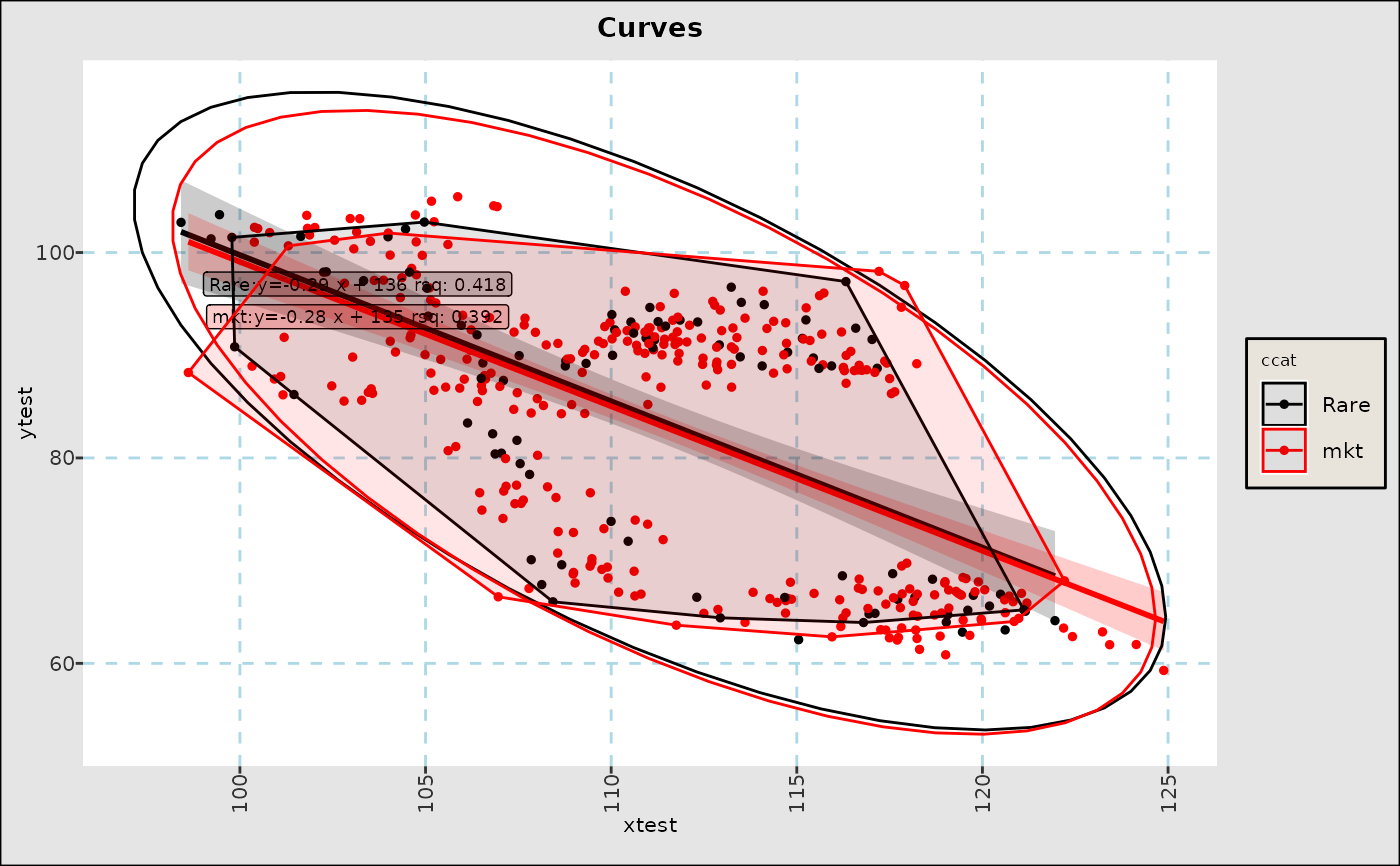
fg_scatplot(dttest,"ytest ~ xtest + color:ccat + hull:0.1 + ellipse","lm",title="Curves")
# Extra summarizatons
fg_scatplot(dttest,"ytest ~ xtest + color:ccat + hull:0.1 + ellipse","lm",title="Curves")
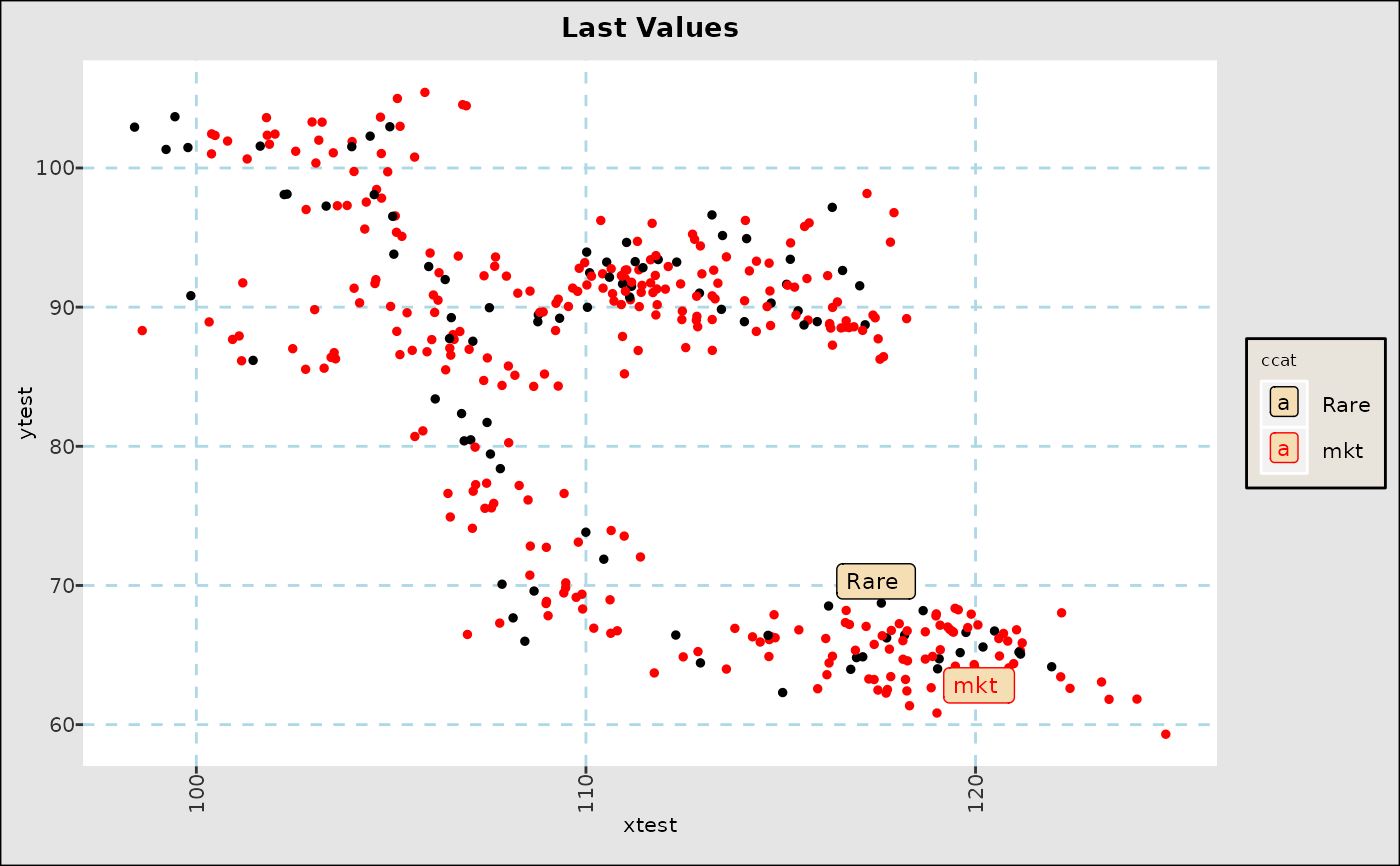
 # Annotations
fg_scatplot(dttest,"ytest ~ xtest + color:ccat + point:labelall","scat",title="Last Values")
# Annotations
fg_scatplot(dttest,"ytest ~ xtest + color:ccat + point:labelall","scat",title="Last Values")
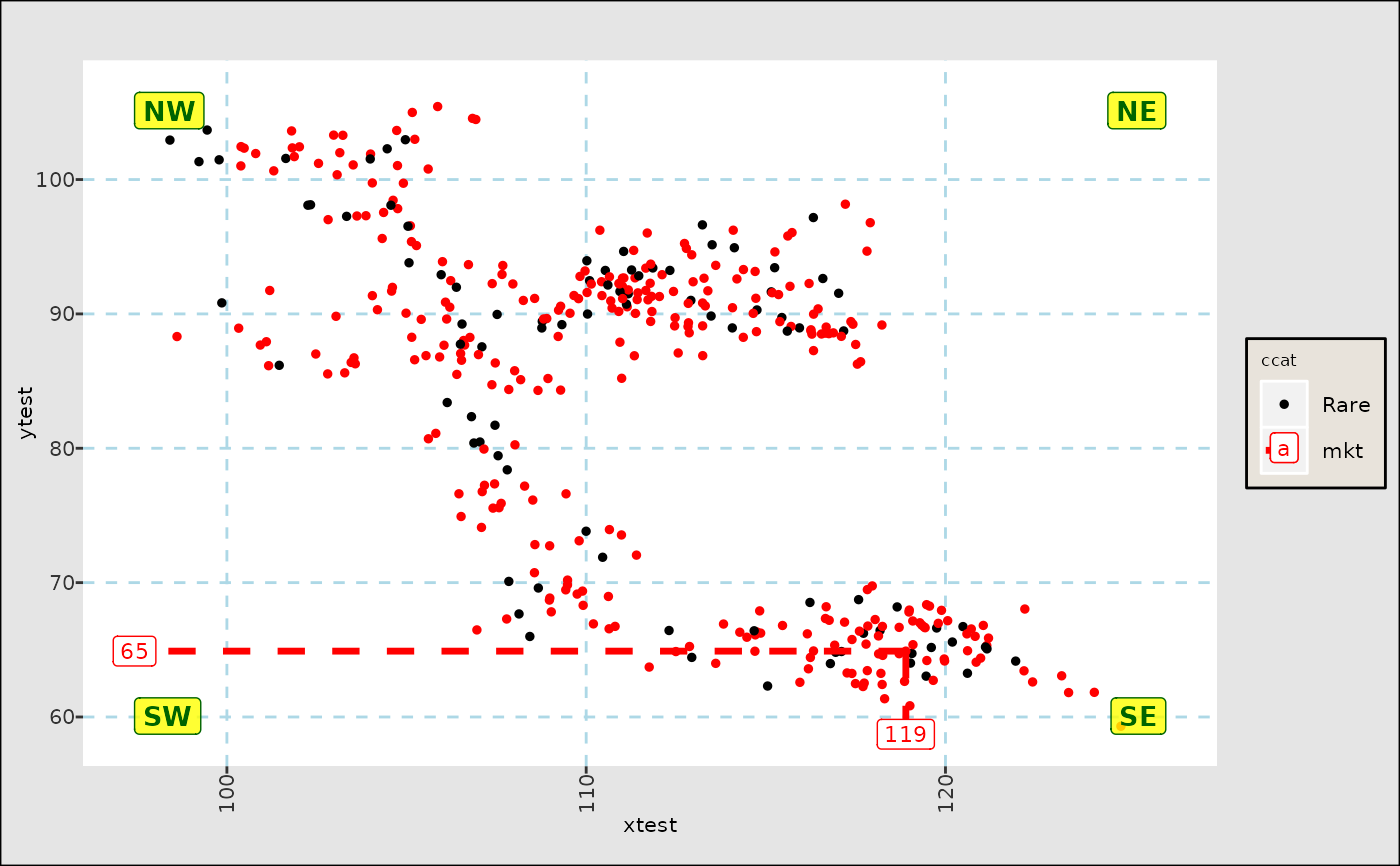
 fg_scatplot(dttest,"ytest ~ xtest + color:ccat + point:anno","scat",annotatecorners="NW;NE;SE;SW",
legendinside = FALSE)
fg_scatplot(dttest,"ytest ~ xtest + color:ccat + point:anno","scat",annotatecorners="NW;NE;SE;SW",
legendinside = FALSE)