FinanceGraphs-Customization
Source:vignettes/FinanceGraphs-customization.Rmd
FinanceGraphs-customization.Rmd
suppressPackageStartupMessages(require(dplyr))
suppressPackageStartupMessages(require(data.table))
suppressPackageStartupMessages(require(ggplot2))
suppressPackageStartupMessages(require(FinanceGraphs))
Overview of Aesthetics Organization
Managing a consistent look across graphs is not easy, as there are so many parameters that are possible to change. ggplot2 does a great job allowing every detail to be customized, especially with the use of themes. However, adding all those customizations are burdensome, and ad-hoc changes to them can involve a great deal of programming. Ideally, we would like to keep our favorite looks in one place with an easy ability to change just a few pieces in an ad-hoc manner.
The functions in the package attempt to ease that burden with a
middle layer of named aesthetic groups. Aesthetics can be
managed just like any other data, so internal to the package is a
data.table with the following character columns, plus a few
others:
| Column | Description |
|---|---|
| Category | An “aesthetic set” key grouping together various subparts of a graph. |
| (Ordering) Variable | Any string that can sorted to keep the aesthetics in a desired order |
| Type | The type of aesthetic (e.g. color, size, symbol, etc) |
| Value | The actual aesthetic to be used. If a number, then each function casts appropriately |
| used | Where the function is used |
Each FinanceGraphs function has internal aesthetic names (and
defaults) that a user can modify, either persistently or temporarily.
For example, the basic set of colors for categories is
"lines", which are the line colors for
fgts_dygraph() or the category colors for
fg_scatplot.
fg_get_aes("lines", n_max=6)
#>    category variable  type     value const used                     helpstr
#> 1:    lines      D01 color     black        all Low cardinality line colors
#> 2:    lines      D02 color       red        all Low cardinality line colors
#> 3:    lines      D03 color      blue        all Low cardinality line colors
#> 4:    lines      D04 color darkgreen        all Low cardinality line colors
#> 5:    lines      D05 color    orange        all Low cardinality line colors
#> 6:    lines      D06 color      gray        all Low cardinality line colors
Changing the look of graphs is as easy as changing the values in that
internal dataset. In some cases (e.g. in fg_scatplot()) a
user can make an entire new aesthetic set with a new (unique) name and
directly specify it in the function call. The package keeps those
changes persistently (by default), so each users’ preferences should
only need to be specified once.
Getting current aesthetics
There are two ways to get the aesthetic sets for every graph in the package:
- Call the function
fg_print_aes_list()with the name of a function as an argument - Call the function
fg_verbose()to turn on logging of what aesthetic sets are called for any given graph generated.
For example, here are the a few aesthetic sets for
fg_eventStudy(). This function just produces a summary, so
for example there are actually 14 different line colors in
"lines".
print(fg_print_aes_list("fg_eventStudy"))
#>
#>
#> |category    |helpstr                     |default   |  N|
#> |:-----------|:---------------------------|:---------|--:|
#> |lines       |Low cardinality line colors |black     | 14|
#> |espath_fill |Fitline fill color          |#C2DF23FF |  1|
#> |espath_gp   |Brewer colors if used       |seq,BuGn  |  1|
#> |espath_line |fitline color               |#433E85FF |  1|
#> |espath_lm   |Fit line color              |black     |  1|
#> |espath_ls   |Line styles per event       |84        |  9|
#> |espath_x    |Scatterplot x color         |gray      |  1|
#> |espath_y    |Scatterplot y color         |darkgreen |  1|
Each set can have multiple rows, as in
fg_get_aes("espath_ls", n_max=6)
#>     category variable      type value const          used               helpstr
#> 1: espath_ls      L01 linestyle    84       fg_eventStudy Line styles per event
#> 2: espath_ls      L02 linestyle  8282       fg_eventStudy Line styles per event
#> 3: espath_ls      L03 linestyle  8484       fg_eventStudy Line styles per event
#> 4: espath_ls      L04 linestyle    22       fg_eventStudy Line styles per event
#> 5: espath_ls      L05 linestyle    24       fg_eventStudy Line styles per event
#> 6: espath_ls      L06 linestyle  4242       fg_eventStudy Line styles per event
These correspond directly to ggplot2 aesthetics, such as the linetypes in linetypes. Some other notes:
- Each value is a character column, but is coerced as necessary in
each function.
- In the cases of sizes, the values are multiples of the function
parameters
psizeandtsize. So, a text size value of"6"gets converted totsize * 6in each function. - The
"variable"column tells the functions to use"L01"first,"L02"second, etc. As long as the key is sortable, consistent and correct values should be used. - In the case of category overload, most functions have “color switch”
parameters beyond which colors are “brewed” scales which are infinitely
(but not wisely) expandable. In this case, the value is
"seq,<colorset>"which generates colors from a Colorbrewer color set. - Colors can be color names or Hex color codes.
Colors in particular may be examined using the
fg_display_colors() function as in
fg_display_colors("lines")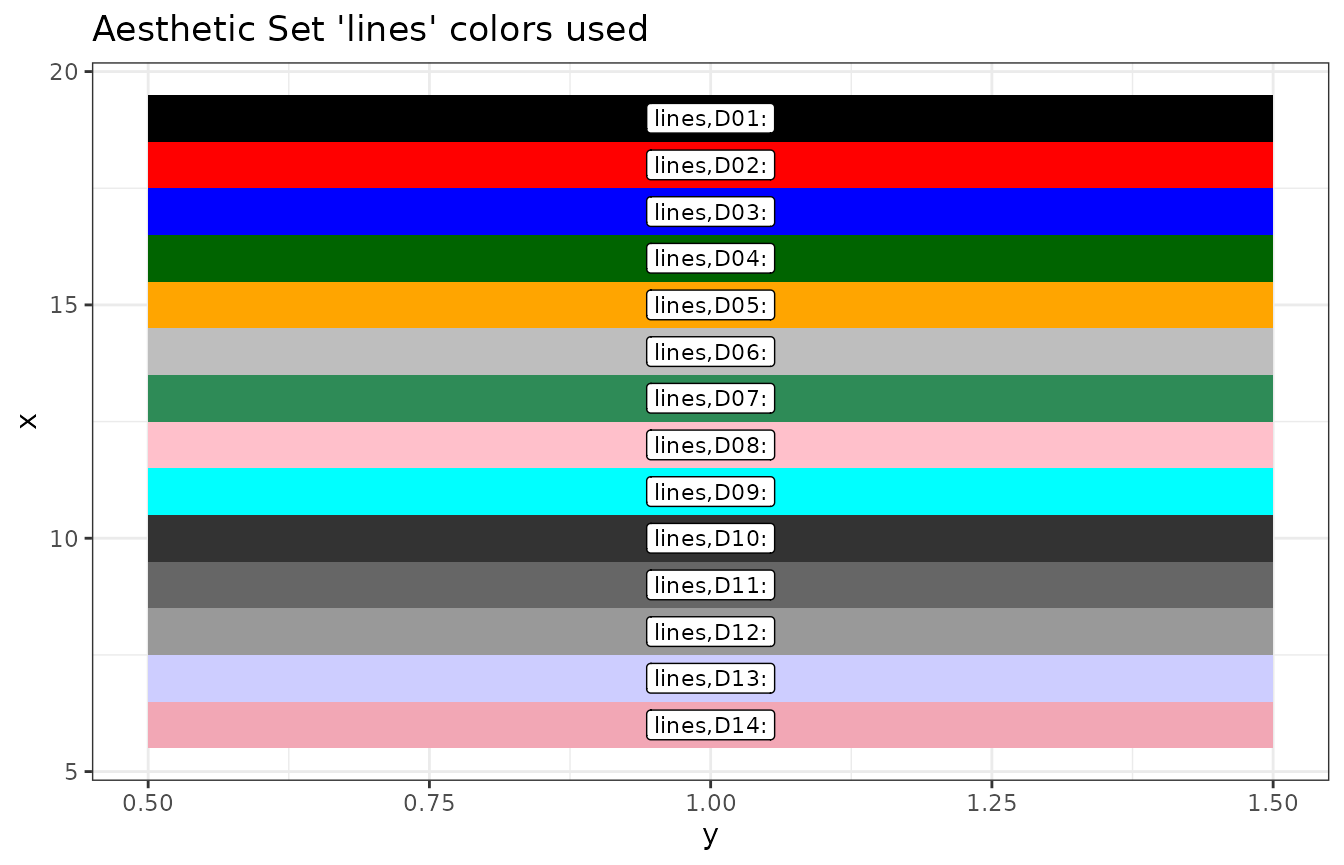
Adding or customizing aesthetics
Any of the default aethetic sets can be customized across calls to
the functions and invocations of the package using
fg_update_aes() New aesthetics sets can also be added for
those functions (e.g. fg_scatplot()) where different
aesthetic sets can be specified at runtime.
Modifying or adding aesthetics sets is done by creating (or copying
and editing) a data.frame obtained from
fg_get_aes() As a simple example, suppose we have three
related classes of assets, one of which we wish to highlight and the
others are related, but less important. Here is how the default colors
would look:
onedt <- function(offset,category) { data.table(x=seq(1,10),y=seq(1,10)-offset,id=rep(category,10))}
exampledta <- rbind(onedt(0,"A"),onedt(1,"B"),onedt(2,"C"))
fg_scatplot(exampledta,"y ~ x + color:id",title="default",psize=6)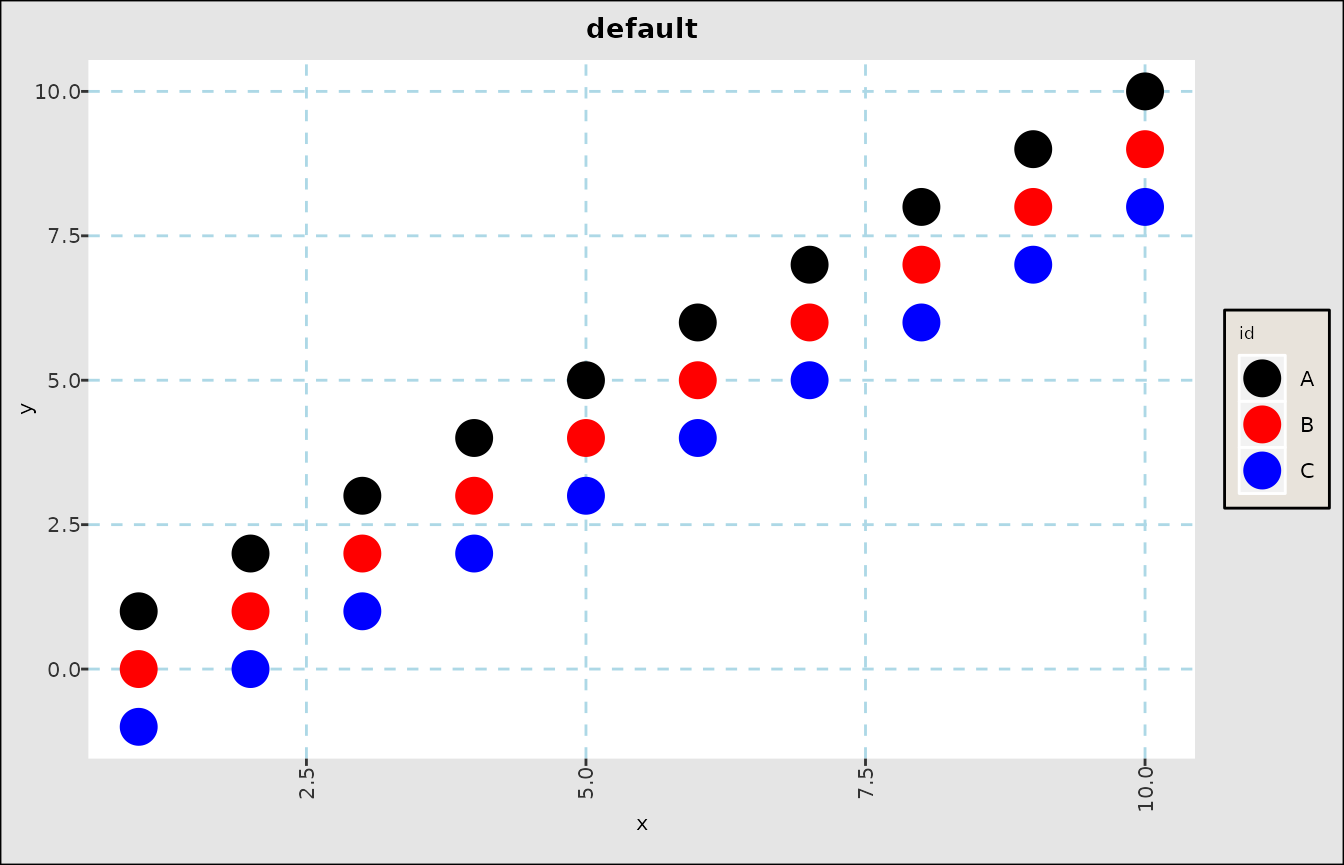
Customizing default aesthetics
The procedure for changing those colors is as follows:
- Get an example
data.frameusingfg_get_aes() - Modify the values you want to change in the
valuecolumn - Update the persistent package data using
fg_update_aes()
head(oldcolors <- fg_get_aes("lines"),3)
#>    category variable  type value const used                     helpstr
#> 1:    lines      D01 color black        all Low cardinality line colors
#> 2:    lines      D02 color   red        all Low cardinality line colors
#> 3:    lines      D03 color  blue        all Low cardinality line colors
oldcolors[c(1,2,3),"value"] <- alpha("blue", c(1,0.6,0.3))
# Note that we still keep "category" as "lines".  To add a new set, use a different name.
fg_update_aes( oldcolors )
#> Saved aesthetic updates to /home/runner/.cache/R/FinanceGraphs/fg_aes.RD
fg_display_colors("lines")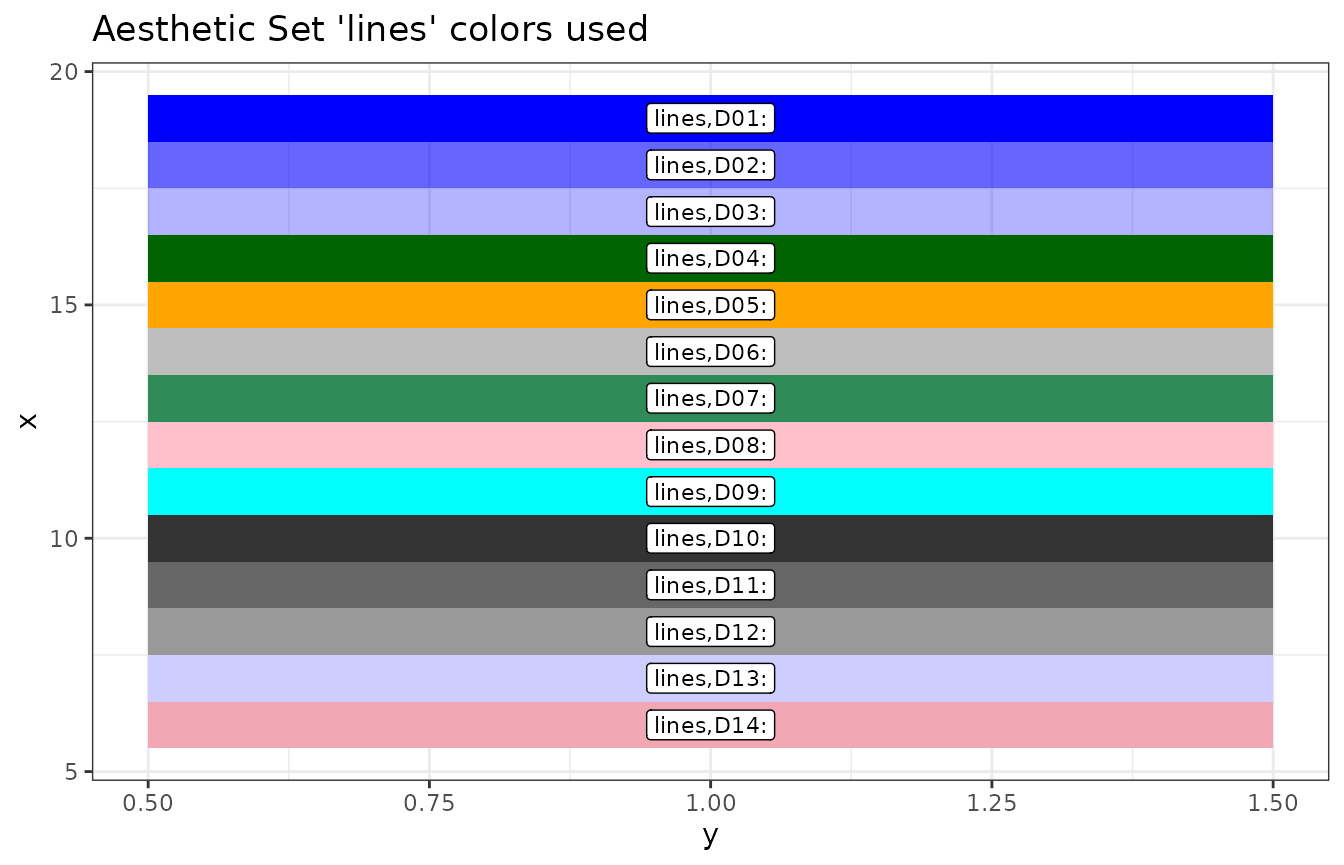
fg_scatplot(exampledta,"y ~ x + color:id",title="default",psize=6)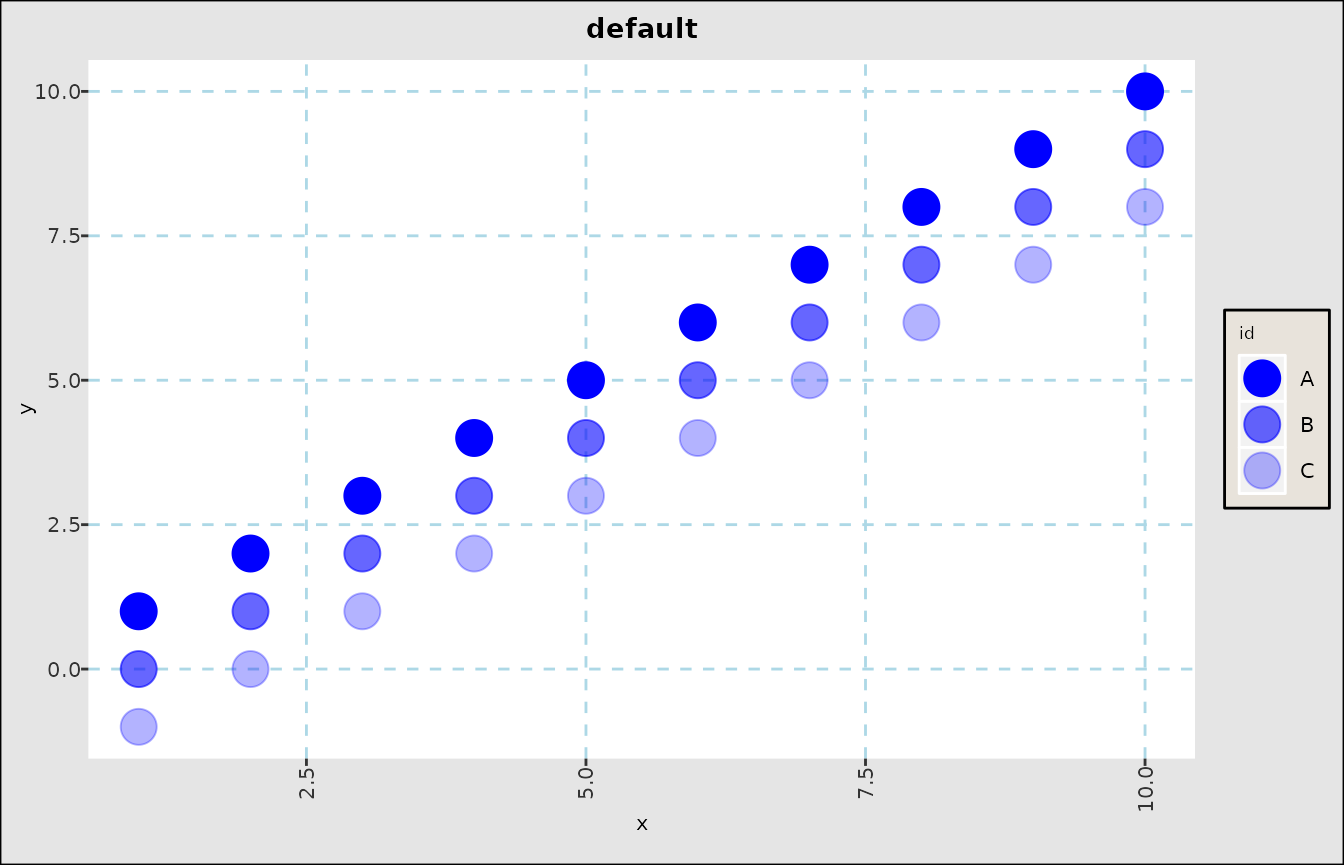
Adding new aesthetics
To create our own aesthetics, we use the same procedure, but adding
our own "category":
oldcolors[c(1,2,3),"value"] <- alpha("red", c(1,0.6,0.3))
oldcolors[c(1,2,3),"category"] <- rep("MyNewColors",3)
fg_update_aes( oldcolors )
#> Saved aesthetic updates to /home/runner/.cache/R/FinanceGraphs/fg_aes.RD
fg_scatplot(exampledta,"y ~ x + color:id,MyNewColors",title="with new colors",psize=6)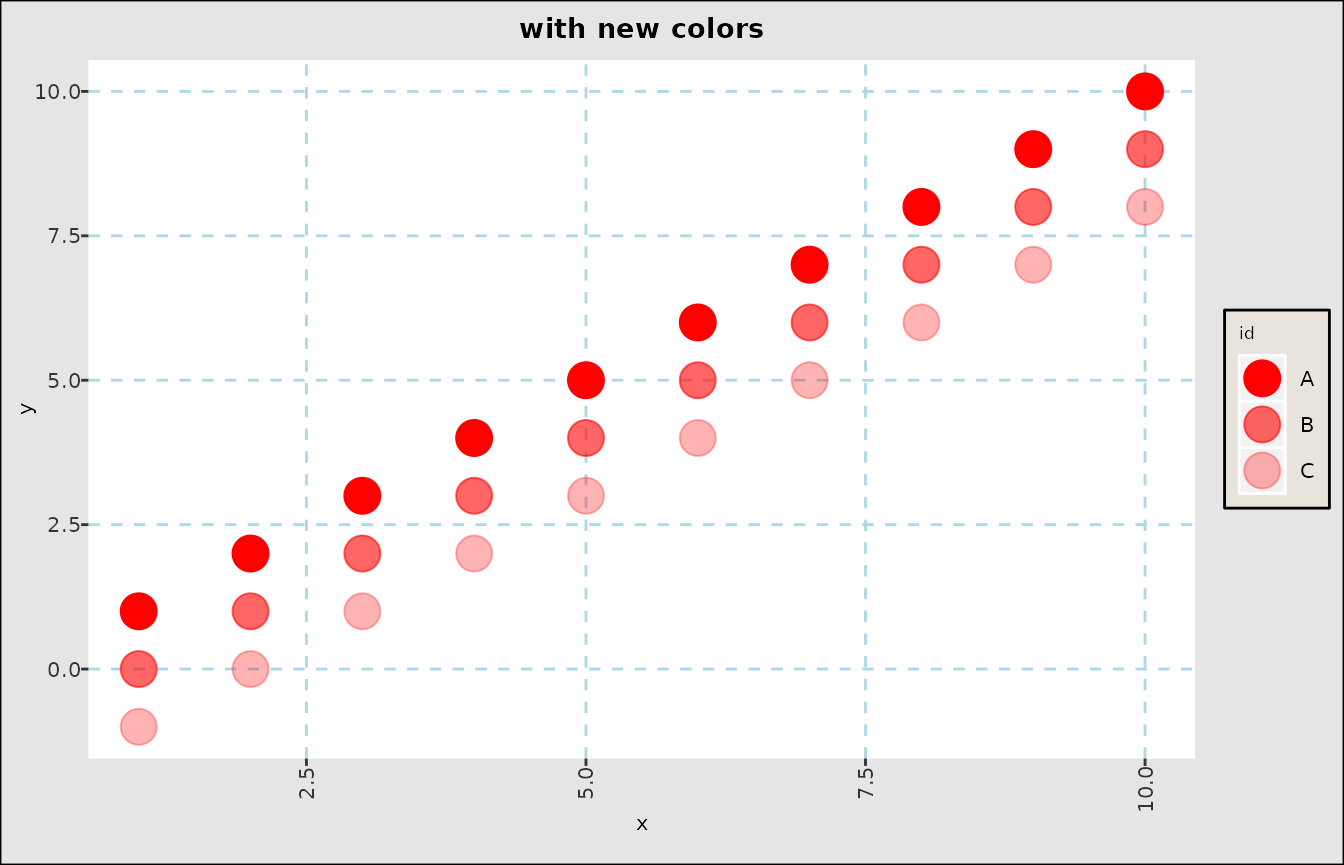
Themes
Themes are the ggplot2
way of proscribing every single aesthetic detail in a graph. This
package uses a default theme derived from theme_bw(), but
it is quite easy to create or modify, and more importantly
save, a custom theme for future use.
To do so, just call fg_replace_theme() as in the
following example:
fg_replace_theme(theme_dark())
#> Saved Default Theme to /home/runner/.cache/R/FinanceGraphs/fg_theme.RD
fg_scatplot(exampledta,"y ~ x + color:id,MyNewColors",title="New Theme, New Colors",psize=6)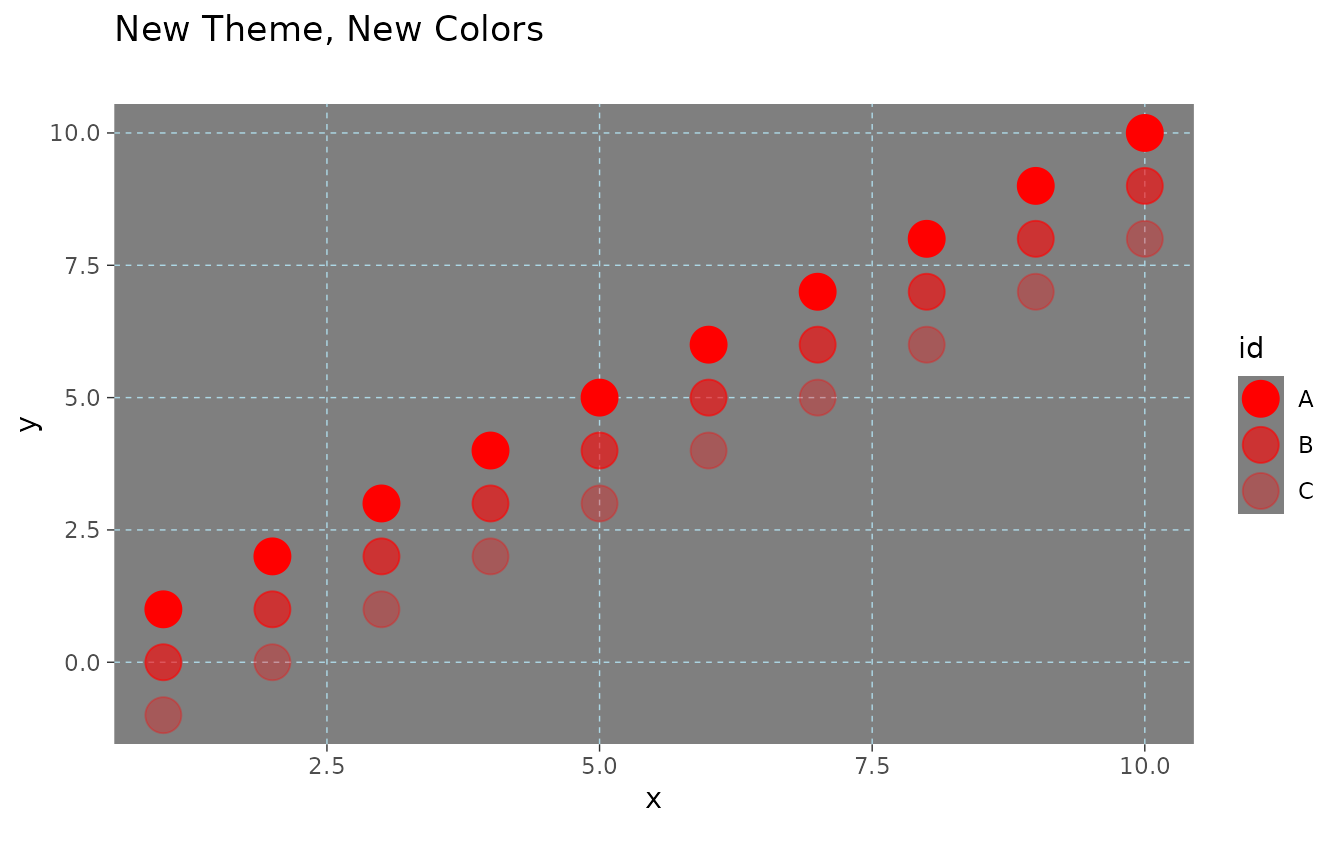
Persistence
Saved Aesthetics, themes and dates of interest persist
This package manages aesthetic changes for you by caching the current
aesthetic sets, themes, and dates of interest in local files, which are
then loaded on package invocation. If you don’t want
save changes, then call fg_update_aes() and
fg_replace_theme() with persist=FALSE
parameters.
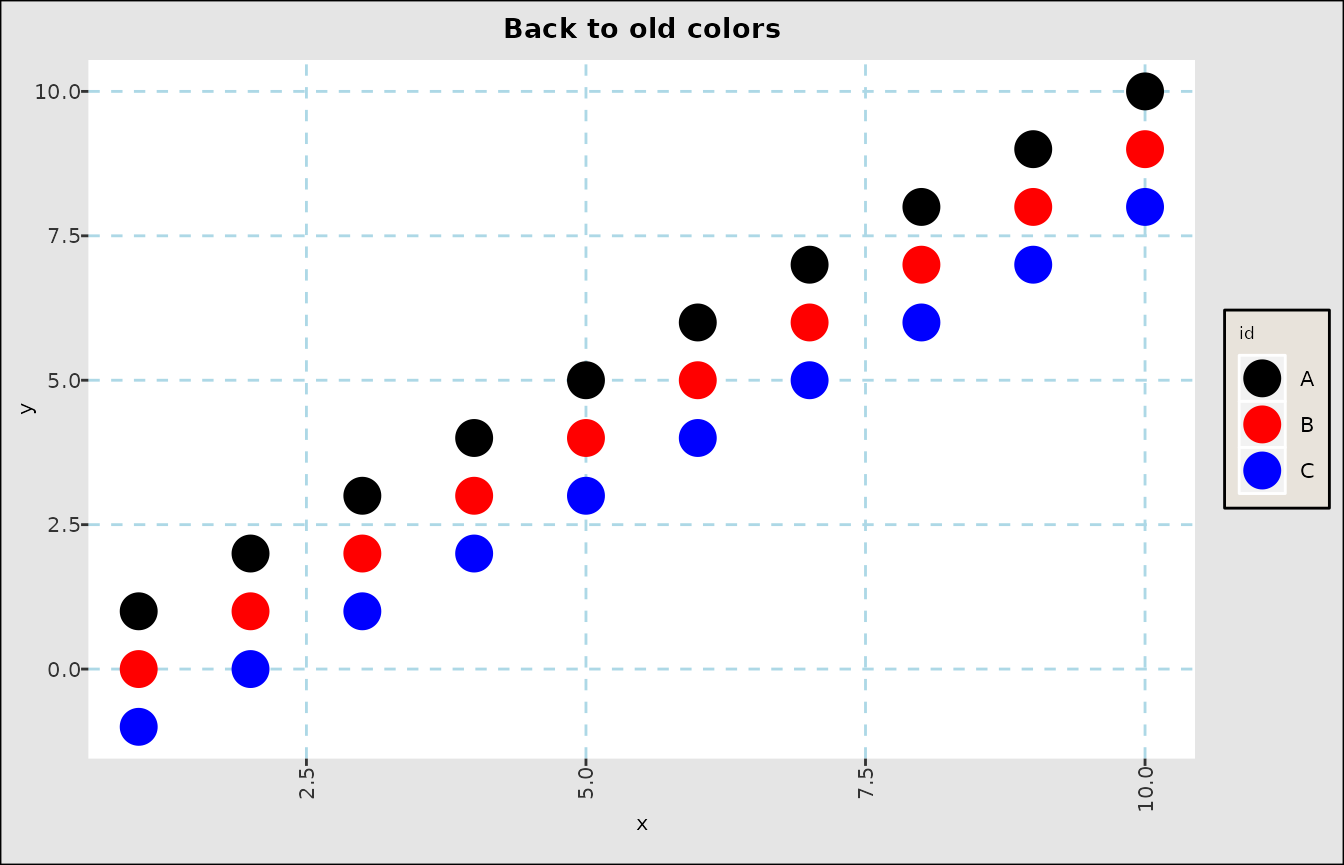
To reset all parameters back to the package defaults, run
fg_reset_to_default_state()
fg_reset_to_default_state("all")
#> Removing dates file and reverting to defaults of package
#> Removing Aesthetics file and reverting to defaults of package
#> Removing User-made Themes and reverting to defaults of package
#> Removing cache Directory
#> fg_reset_to_default_state(all) completed
fg_scatplot(exampledta,"y ~ x + color:id",title="Back to old colors",psize=6)